Koh Samui Villa Investment 2026: Why Yields Outperform Phuket (Real Data Inside)
Koh Samui Villa Investment 2026: The Data Case for Thailand’s Second Island
Koh Samui’s luxury vacation home market surged 63.5% in H1 2025, recording 52 projects with 597 units and $423 million (14.8 billion baht) in investment value. Net rental yields of 7.2-7.5% are being achieved across SKHAI’s STAYLAR-managed portfolio — competitive with Phuket, but at entry prices that start $25,000-$50,000 lower. And with 56% of international arrivals coming from Europe, the island’s guest profile aligns precisely with the demographic that books private villas.
Koh Samui is not a cheaper alternative to Phuket. It is a different investment thesis — one built on supply constraints, dual-peak seasonality, and a European-dominated visitor base that delivers longer stays and higher per-booking revenue.
Market Overview: Where Samui Stands in 2026
Here are the key numbers defining Koh Samui’s property market right now:
| Metric | 2025 Data | Trend |
|---|---|---|
| Luxury vacation home investment | $423M (14.8B THB) in H1 alone | Up 63.5% vs H2 2024 |
| Projects launched (H1 2025) | 52 projects, 597 units | Significant acceleration |
| Passenger arrivals (Jan-Apr 2025) | 1.13 million | Up 9% YoY |
| European share of international arrivals | 56% | Steady (UK, Germany, France lead) |
| Condo supply share | 52% of total supply | Shifting from villa-dominated |
| Price per sqm (condo) | $1,715-$2,285 (60K-80K THB/sqm) | Rising |
| Pool villa entry (inland) | From $145,000 (5M THB) | Stable |
| Pool villa entry (sea view) | From $285,000 (10M THB) | Appreciating 6-8% annually |
STAYLAR Portfolio Performance: Samui vs Phuket
SKHAI operates developments in both Koh Samui and Phuket, managed by the same STAYLAR hospitality team. This provides a direct, apples-to-apples comparison that eliminates the variable of management quality.
| Development | Location | Net Yield | Occupancy | Entry Price |
|---|---|---|---|---|
| Koh Samui | ||||
| Coral Cove Residences | Lamai | 7.5% | 70% | From $265,000 |
| Sunrise Residences | Chaweng Noi | 7.2% | 68% | From $250,000 |
| Phuket (for comparison) | ||||
| Sunrise Garden | Cherngtalay | 8.4% | 78% | From $275,000 |
| Sunrise Palms | Pasak | 8.1% | 74% | From $295,000 |
| Sunrise Valley | Cherngtalay | 7.8% | 72% | From $285,000 |
The comparison tells an important story: Samui’s net yields (7.2-7.5%) trail Phuket’s (7.8-8.4%) by approximately 0.6-0.9 percentage points. But Samui entry prices are $10,000-$45,000 lower — meaning the dollar-for-dollar return on capital is closer than the yield percentages suggest. And Samui’s capital appreciation rate (6-8% annually) is competitive with, and in some areas exceeds, Phuket’s.
Why Samui Yields Outperform Expectations
1. Dual-peak seasonality
This is Samui’s most underappreciated advantage. Unlike Phuket, which has a single dominant high season (November-April), Koh Samui benefits from two distinct peak periods:
- December – February: European winter escape season. UK, German, and French families dominate bookings. Highest ADR and occupancy of the year.
- July – August: European summer holiday season. Families with school-age children book 2-4 week stays. This second peak is unique to Samui — Phuket’s west coast faces monsoon conditions during this period.
The result: Samui’s revenue is more evenly distributed across the calendar year than Phuket’s. This reduces the feast-or-famine dynamic that characterizes single-season markets and provides more predictable cash flow for investors.
2. Supply constraints are structural
Koh Samui is Thailand’s second-largest island — but it is significantly smaller than Phuket and has more restrictive building regulations. Key supply constraints:
- Limited flat land: Much of Samui is mountainous terrain, restricting villa development to coastal strips and valleys
- Height restrictions: Buildings cannot exceed coconut tree height (approximately 12 meters) in most zones
- Environmental regulations: Stricter than Phuket, particularly around hillside and coastal construction
- Infrastructure capacity: A single airport with limited expansion potential creates a natural ceiling on visitor numbers — and therefore on the type of development the island can support
These constraints are positive for investors: they prevent the oversupply that erodes yields in less regulated markets.
3. Airport capacity as an investment thesis
Koh Samui Airport is privately operated by Bangkok Airways and handles approximately 3 million passengers annually. Unlike Phuket (19.7 million), the airport operates at controlled capacity. This creates a scarcity dynamic: the island’s visitor numbers are effectively capped by runway capacity.
For villa investors, this means:
- Demand is consistently strong relative to supply (visitors are pre-qualified by flight availability and cost)
- Visitors tend to be higher-spending (flight premiums to Samui are 30-50% above Phuket)
- Competition from mass-market tourism is limited
- Any future airport expansion — even modest — would disproportionately boost property values
4. European visitor profile aligns with villa demand
56% of Samui’s international arrivals are European — primarily from the UK, Germany, and France. This demographic typically:
- Books 14-28 day stays (vs. 7-10 days for Asian source markets)
- Travels in family groups of 4-8 (ideal for villa accommodation)
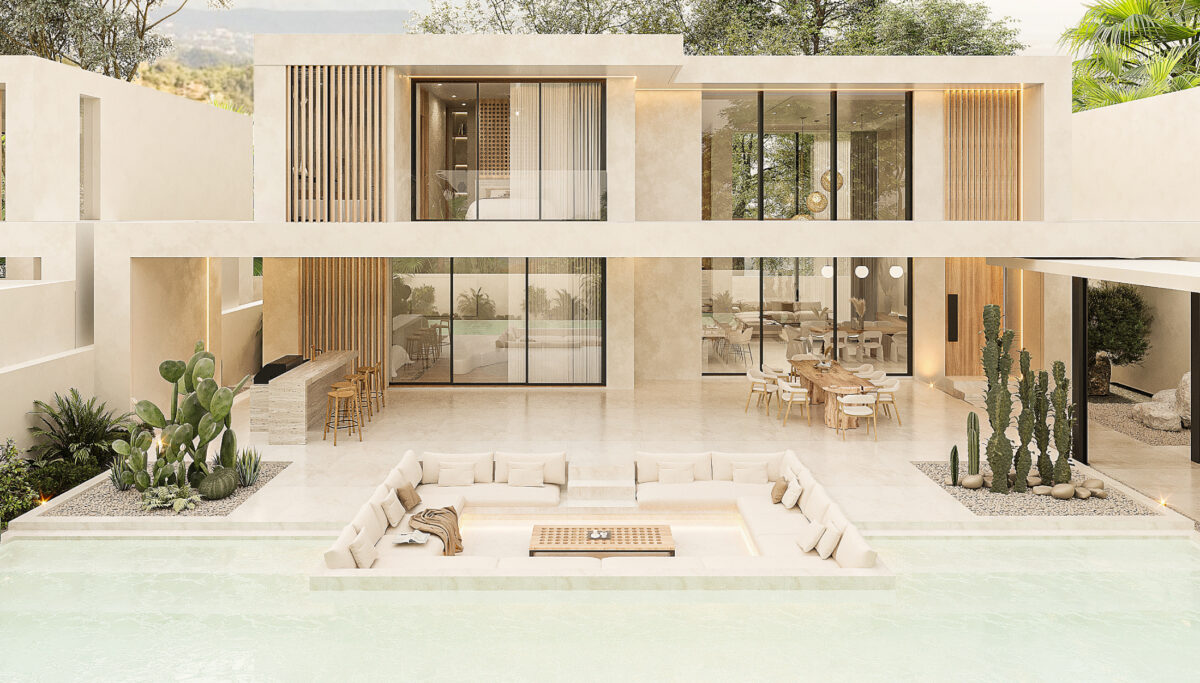
- Prefers private pools and self-contained living over hotel rooms
- Has higher per-trip spending capacity
This guest profile generates higher revenue per booking and lower turnover costs — both of which support net yields.
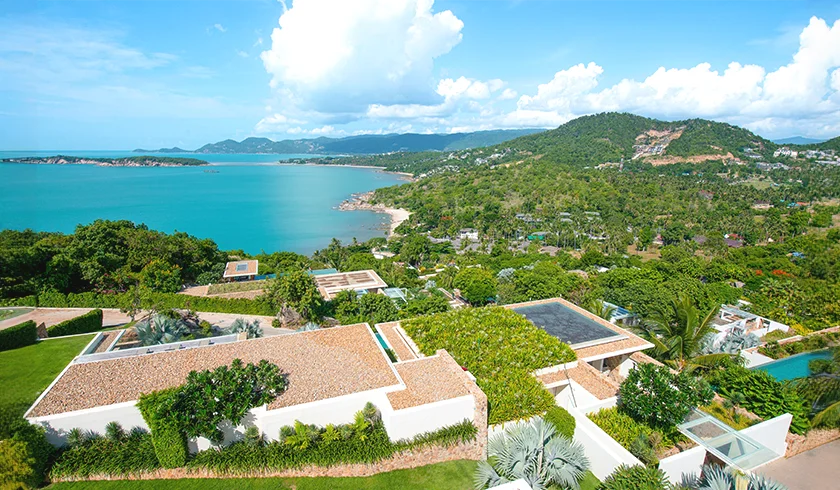
Best Areas for Villa Investment in Koh Samui
Chaweng Noi
The premium investment zone. Sea-view villas with strong rental demand, proximity to Chaweng’s amenities without the congestion. SKHAI’s Sunrise Residences is positioned here — 7.2% net yield, 68% occupancy. Entry from $250,000.
Lamai
More relaxed atmosphere, lower entry prices, improving infrastructure. Coral Cove Residences delivers 7.5% net yield at 70% occupancy — the highest Samui yield in SKHAI’s portfolio. Growing popularity with European families seeking a quieter alternative to Chaweng.
Bangrak (Big Buddha)
Sunset views, family-friendly, proximity to Fisherman’s Village. Moderate pricing with upside potential as the area develops. Popular with long-stay renters and the growing digital nomad segment.
Bophut / Maenam
Value-oriented entry points with established tourism infrastructure. The Fisherman’s Village in Bophut is one of Samui’s most photographed destinations, driving consistent foot traffic and short-term rental demand.
Choeng Mon
Quiet northeast corner with premium beachfront. Lower rental volumes but higher ADR. Suits investors prioritizing personal use alongside rental income.
Ownership Structures for Foreign Buyers in Koh Samui
The same ownership structures available in Phuket apply to Koh Samui:
- Leasehold (30-year registered lease): The standard structure for villa ownership. Registered at Samui’s Land Department with exclusive use rights.
- Freehold condominium: Available for condo units (up to 49% foreign quota). Less relevant for villa investors.
- Thai company structures: Legitimate joint ventures with genuine Thai partners are possible but require proper legal structuring. Nominee arrangements are illegal.
SKHAI recommends engaging independent legal counsel based on Koh Samui for all transactions. Read our full ownership structure guide for detailed analysis.
Samui vs Phuket: Decision Framework
Rather than declaring one island “better,” here is how to match each destination to your investment objectives:
| Investment Priority | Phuket | Koh Samui |
|---|---|---|
| Highest absolute net yield | Phuket (8.4% top) | — |
| Lowest entry price | — | Samui (from $250K) |
| Most mature rental market | Phuket | — |
| Dual-peak seasonality | — | Samui (Dec-Feb + Jul-Aug) |
| Supply-constrained market | — | Samui (airport cap, terrain) |
| Lifestyle + personal use | More amenities, larger island | More intimate, relaxed pace |
| International schools | Multiple options | Limited |
| Healthcare infrastructure | International standard | Adequate but more limited |
| Liquidity (resale market) | Deeper, more active | Growing but thinner |
| Capital appreciation potential | 5-10% annually | 6-8% annually |
Many SKHAI investors hold villas in both destinations — Phuket for yield and liquidity, Samui for diversification and personal use. The portfolio approach spreads seasonal and market risk. See our full destination comparison for deeper analysis.
SKHAI Developments in Koh Samui
SKHAI’s Samui portfolio includes multiple developments across the island’s prime investment zones:
- Sunrise Residences — Chaweng Noi. 7.2% net yield, 68% occupancy. From $250,000.
- Coral Cove Residences — Lamai. 7.5% net yield, 70% occupancy. From $265,000.
All managed by STAYLAR for rental program investors, with dynamic pricing, multi-platform distribution, and monthly performance reporting. Explore Koh Samui investment opportunities.
Investment Scenario: Samui Villa 5-Year Projection
Here is a realistic 5-year investment scenario based on STAYLAR portfolio data from Coral Cove Koh Samui (7.5% net yield, 70% occupancy):
| Year | Property Value | Net Rental Income | Capital Appreciation (7%) | Cumulative Total Return |
|---|---|---|---|---|
| Purchase | $265,000 | — | — | — |
| Year 1 | $283,550 | $19,875 (7.5% net) | $18,550 | $38,425 (14.5%) |
| Year 2 | $303,399 | $21,266 | $19,849 | $79,540 (30.0%) |
| Year 3 | $324,636 | $22,755 | $21,237 | $123,532 (46.6%) |
| Year 5 | $371,690 | $26,105 (cumulative ~$117K) | — | ~$223,690 (84.4%) |
Key assumptions: 7.5% net yield (Coral Cove actual), 7% annual capital appreciation (mid-range for Samui prime), rental income growth tracking property value. This projects approximately 84% total return within 5 years on a $265,000 investment — delivering both lifestyle value and financial performance.
Samui’s Guest Demographics: Who Rents Your Villa
Understanding who rents villas in Koh Samui — and when — is essential for modeling revenue and marketing strategy:
European families (December – February, July – August)
The primary demand segment. Families of 4-8 from the UK, Germany, France, and Scandinavia book 14-28 day stays during school holidays. They seek private pools, multiple bedrooms, kitchen facilities, and proximity to beaches and restaurants. Average booking value: $4,000-$12,000. This segment drives both peak seasons and generates the highest per-booking revenue.
Couples and honeymooners (year-round, peak November – March)
Samui’s romantic reputation attracts couples seeking privacy and exclusivity. They book 7-14 day stays and accept premium pricing for sea-view properties. Average booking value: $2,000-$5,000. Consistent demand outside family peak periods, helping smooth revenue curves.
Remote workers and digital nomads (year-round, growing segment)
Extended stays of 30-90 days at lower nightly rates but with virtually zero turnover costs. This segment fills low-season gaps and has grown 40%+ since 2022. Samui’s reliable internet infrastructure, co-working spaces, and lifestyle appeal make it a top digital nomad destination in Southeast Asia.
Event and celebration bookings (sporadic, premium pricing)
Weddings, milestone birthdays, and corporate retreats generate premium per-night rates — often 2-3x standard pricing. Samui’s intimate scale and natural beauty make it a sought-after event destination. A single week-long wedding booking can equal 3-4 weeks of standard rental revenue.
Domestic tourism (year-round, growing)
Thai families and couples increasingly choose Samui for weekend getaways and holiday trips. While shorter stays (2-4 nights) with lower ADR, domestic demand provides a buffer against international travel disruptions and fills mid-week gaps. Bangkok Airways’ direct flights from Suvarnabhumi make Samui accessible for domestic travellers.
The Rental Management Factor
In Koh Samui — where the rental market is less mature than Phuket’s and professional management is less widely available — the choice of rental management has an outsized impact on returns. A well-managed villa on Samui can outperform a poorly managed property by 50-80% in annual revenue.
Critical management functions for Samui properties include:
- Multi-platform distribution: Samui is less dependent on Airbnb than Phuket. Booking.com, Agoda, and luxury villa platforms (The Asia Collective, Villalet) are essential for reaching European bookers. Single-platform listings leave significant revenue on the table.
- Dynamic pricing: Samui’s dual-peak season creates complex pricing opportunities. Rates should vary by 60-100% between peak and low season — far more than most self-managed properties adjust.
- European marketing: Given that 56% of international arrivals are European, marketing should target UK, German, and French travel audiences specifically. STAYLAR’s multi-language listing strategy and European travel platform presence is built for this demographic.
- Maintenance in tropical climate: Samui’s humidity and proximity to salt air demand rigorous maintenance schedules — pool systems, air conditioning, roofing, and landscaping all require more frequent attention than temperate-climate properties.
STAYLAR manages all SKHAI properties in Koh Samui with the same hospitality standards applied across the portfolio. The result: 7.2-7.5% net yields with 68-70% occupancy — achieved through professional revenue management, not passive listing. Learn more about STAYLAR’s management approach.
Cost of Entry and Annual Ownership Costs
Koh Samui’s lower entry prices versus Phuket extend beyond the villa purchase itself. Here is a comprehensive cost comparison:
| Cost Component | Koh Samui | Phuket (for comparison) |
|---|---|---|
| Pool villa entry price | From $250,000 | From $275,000 |
| Transfer fee (2% appraised) | ~$5,000 | ~$5,500 |
| Legal fees | $1,430-$3,000 | $1,430-$4,300 |
| CAM fees (monthly) | $100-$230 | $115-$285 |
| Insurance (annual) | $400-$900 | $430-$1,145 |
| Property tax (annual) | $50-$200 | $50-$300 |
| Management fees | 20-30% of gross rental | 20-30% of gross rental |
Total acquisition costs (beyond purchase price) for a Samui villa typically amount to 3-4% of the property value — consistent with Phuket. The primary savings are in the lower base price: a $250,000 Samui entry versus $275,000 in Phuket means $25,000 less capital deployed for competitive yield performance.
Sample annual P&L: Coral Cove Koh Samui ($265,000 purchase)
| Line Item | Amount (USD) |
|---|---|
| Gross rental income (70% occupancy) | $27,800 |
| Less: Management fees (25%) | -$6,950 |
| Less: CAM, insurance, maintenance | -$4,200 |
| Less: Utilities and miscellaneous | -$2,700 |
| Net rental income | $19,875 |
| Net yield | 7.5% |
Add estimated capital appreciation of 6-8% ($15,900-$21,200 on a $265,000 villa) and total first-year returns reach 13.5-15.5%. These figures are based on actual STAYLAR performance data — not marketing projections. See our full ROI analysis for methodology and multi-year projections.
Frequently Asked Questions
Is Koh Samui a good property investment in 2026?
The data supports it: 63.5% investment surge in H1 2025, 7.2-7.5% net yields in managed portfolios, supply constraints from geography and airport capacity, and a European visitor base growing 9% year-on-year. The fundamentals are strong for villa investors who choose prime locations and professional management.
What rental yield can I expect from a Samui villa?
STAYLAR-managed properties deliver 7.2-7.5% net yield (after all operating costs). Coral Cove leads at 7.5% net with 70% occupancy. These are conservative, verified figures — not marketing projections. Gross yields are approximately 10-12% before management fees and operating costs.
How does Samui compare to Phuket for rental income?
Phuket delivers higher absolute yields (7.8-8.4% net) and has a deeper rental market. Samui offers lower entry prices, dual-peak seasonality, and structural supply constraints. The net yield gap is approximately 0.6-0.9 percentage points, partially offset by Samui’s lower entry prices.
Can foreigners buy property in Koh Samui?
Yes, through the same structures as Phuket: 30-year registered leasehold (standard for villas) or a freehold condominium (within the 49% foreign quota). Independent legal counsel is essential. See our ownership guide.
What are the best areas to invest in Koh Samui?
Chaweng Noi for premium rental demand and sea views. Lamai for best yield-to-price ratio (7.5% net at Coral Cove). Bangrak for sunset views and family appeal. Bophut/Maenam for value entry with growth potential.
Is Koh Samui oversupplied?
The opposite — supply is structurally constrained by geography (mountainous terrain limiting flat land), building height restrictions, and airport capacity. The 63.5% investment surge in H1 2025 reflects growing demand absorbing limited supply, which supports pricing and yields.
What is the minimum investment for a Samui villa?
SKHAI’s Samui portfolio starts from $250,000 (Sunrise Residences, Chaweng Noi). Inland pool villas from other developers begin around $145,000, though yields at that price point are less predictable.
Does Koh Samui have year-round rental demand?
Yes — this is Samui’s key advantage. The dual-peak season (December-February for European winter, July-August for European summer) provides more evenly distributed revenue than single-peak markets. Low season (April-June, September-November) still delivers 35-50% occupancy with professional management.
Ready to explore Koh Samui? Visit our Koh Samui investment page for current availability, or schedule a consultation to discuss how Samui fits your portfolio strategy.
Data sources: Knight Frank Thailand, Tourism Authority of Thailand, Samui Land Department, SKHAI/STAYLAR portfolio data. Last updated: March 2026.
Get your free investment guide
Ownership structures, yield projections, pricing & floor plans.
Ready to Invest in Koh Samui?
Read our Koh Samui investment guide — ownership structures, yield projections, pricing, and floor plans.
View Koh Samui Investment GuideStay Informed
Luxury real estate insights — delivered to your inbox.
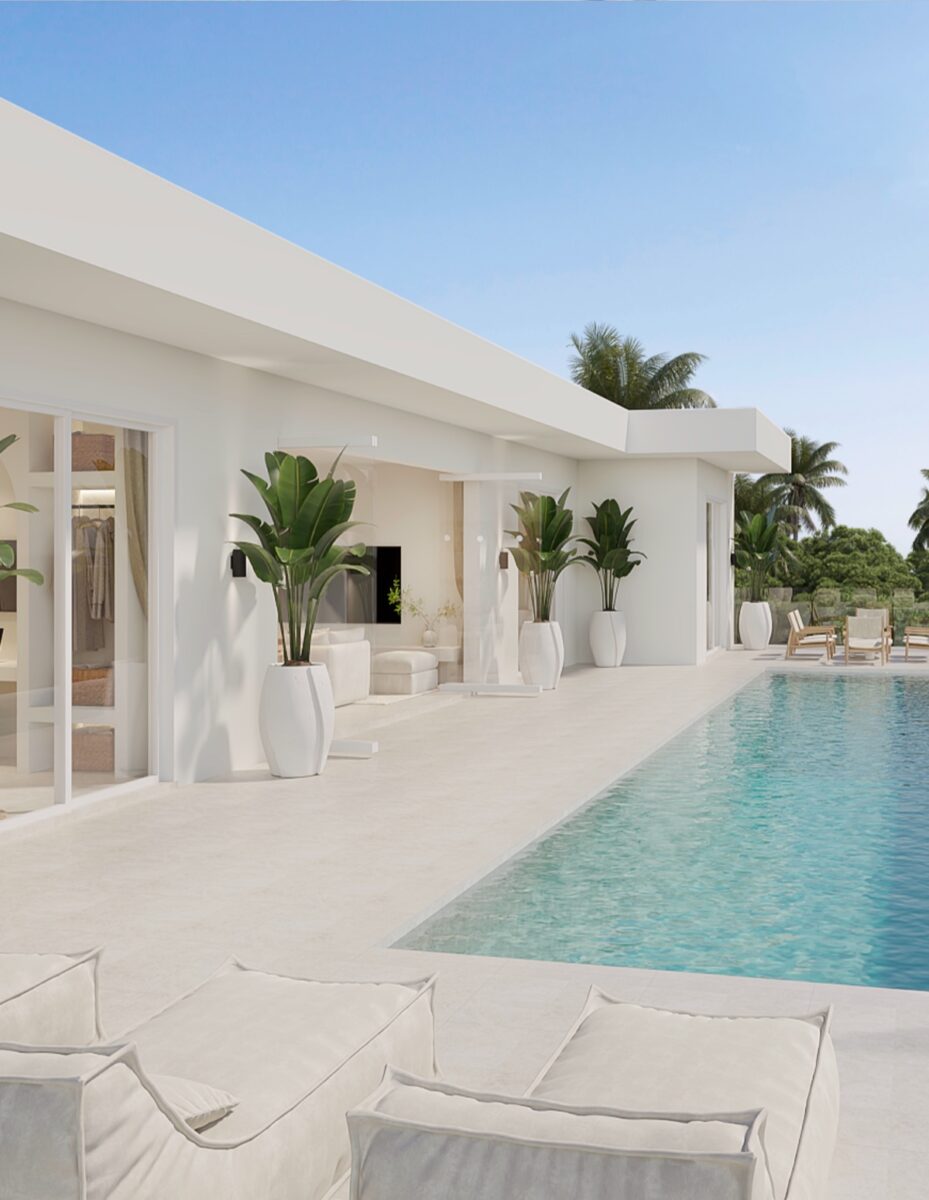
Sunrise Hills Koh Samui
Panoramic hillside villas in Koh Samui — contemporary luxury with ocean views.
View Development →from a Decade
in Real Estate SKHAI
10 Lessons from a Decade in Luxury Real Estate
What we’ve learned building villas across top global destinations — from due diligence to maximising rental returns.
Read the Free Guide →FREE INVESTMENT GUIDE
Get your Koh Samui investment guide
- Ownership structures explained
- Rental yield projections
- Complete pricing & floor plans
- Legal and tax overview
Free guide sent to your inbox. No spam.